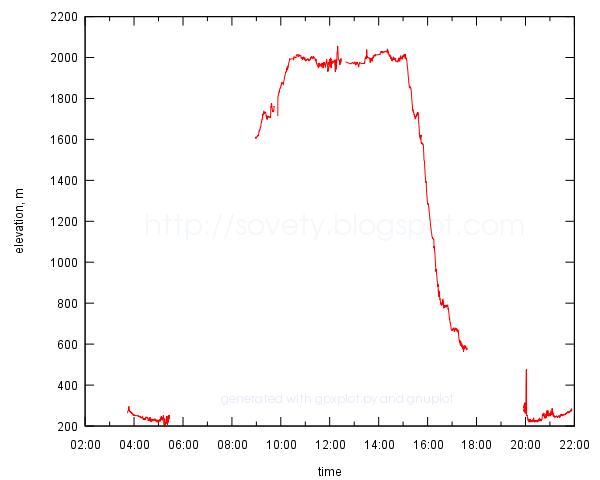
Recently, when doing backups, I noticed a script on my hard drive, which I think may be useful to someone else. It takes an image with a line plot and generates a data file for that plot. So it does an operation inverse to plotting, i.e. unplotting.
Download: unplot.py.
The script is available on bitbucket. Feel free to improve.
To run the script, you first need to decide which part of the plot image you want to scan, and what values the pixels correspond to. I prefer to use Gimp or Geeqie to find pixel coordinates.
If there are many lines on the same plot, You may also decide to colourize the line you are interested in with some distinct colour. Use Gimp if necessary. Write down the colour's HTML code.
This plot is a good point to start:

Then you can run the script against it. In the directory with the script, run:
./unplot.py "#00ff00" 0 151 0 475 5.0 824 0.09 85 /path/to/plot.png > /path/to/data.txt
The first parameter is the HTML colour code of the line to select. Then there is the values and the pixel coordinate of the bottom left corner of the plot: X value, X pixel coordinate, Y value, Y pixel coordinate. Then the same for the top right angle. And finally the name of the file with the plot. The output is redirected to the text file. Please note that the origin of digital images is usually the top left corner.
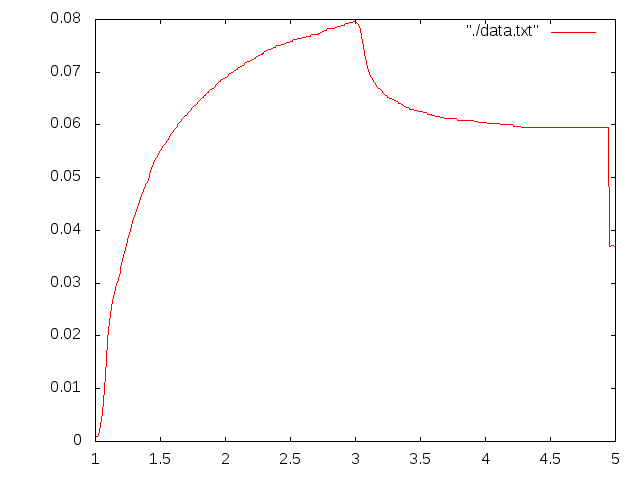
After running the script try plotting the data once again to make sure you selected the right colour and region. I went too far to the right in this example and the green letters were mistaken for the part of the plot.
In Russian: unplot.py: извлекаем табличные данные из графиков.