I think that altitude and velocity profiles of GPS tracks is one of the most intereseting forms of their representation. One can use gpsvisualizer.com to plot such profiles. However, I prefer having free tools for such a simple thing.
Here I offer my own python script gpxplot, which extracts profile data from a GPX file and plots a profile. This is a direct link: gpxplot.py.
There are two important features of the script:
1) GPX file may consist of two or more separate tracks. Each track may consist of several disconnected segments. The script preserves this segmentation of the track.
2) GPX files do not contain explicit information about distane travelled. The script calculcates it using haversine formula (as if the Earth were spherical).
The script can either output profile data in a convinient tabular form, or generate a gnuplot script and call gnuplot to do actual plotting.
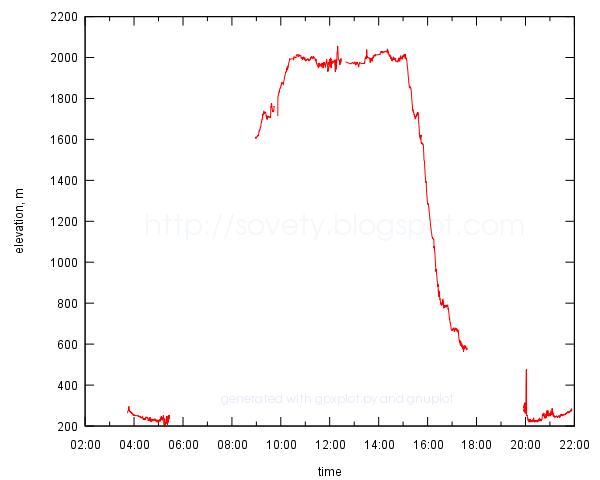
Usage examples are given on a Google Code page. This is what a result may look like:
Update: Now there is also online version of the script. Just upload a track and embed the plot in whatever page you want.

Links:
- Google Code project page: gpxplot.py script
- Web-version of the script: GPXplot online
This announcement in Russian: Визуализация профилей высоты и скорости GPS-треков
